Ras Al Khaimah — Al Hamra & Al Marjan Outlook
A comprehensive analysis of tourism trends, supply–demand dynamics, and capital value projections with strategic insights into the transformative Wynn effect on RAK's real estate market.
Why RAK, Why Now
Tourism pipelines, infrastructure upgrades, and policy stability underpin Al Hamra’s income resilience and Al Marjan’s appreciation potential.
Scope & Methodology
We combine historic performance, forward indicators, and analog markets to quantify risk-adjusted return scenarios across RAK’s prime sub-markets.
How to Read This Report
Scan the executive summary for takeaways, then dive into the charts for demand–supply gaps, yield profiles, and capital growth trajectories.
RAK Investment Outlook 2025
Ras Al Khaimah is in a structural up-cycle, accelerated by the Wynn Al Marjan Island catalyst.
Market Acceleration
Record visitor momentum in 2024–H1 2025 strengthened liquidity and confidence as investors positioned ahead of the 2027 Wynn opening.
Capital values rose 74% over five years, with a sharp 326% surge in the latest year—outpacing other Emirates.
The Wynn Catalyst
Opening in 2027, Wynn is projected to lift annual visitors from 1.2M to 5.5M by 2030—transforming accommodation demand and yields.
Market Dynamics & Investment Profiles
Where Al Hamra provides resilient income, Al Marjan concentrates the upside.
Tourism Growth Trajectory
The Wynn resort signals a paradigm shift. Comparable destinations (e.g., Singapore/Macau) saw step-changes in arrivals within the first year post-launch.
Supply–Demand Dynamics
Projected arrivals outpace near-term room supply, creating an investable gap across residential and hospitality inventory.
Al Hamra vs. Al Marjan
Al Hamra’s mature tenant base and steady seasonal occupancy translate into resilient cash yields.
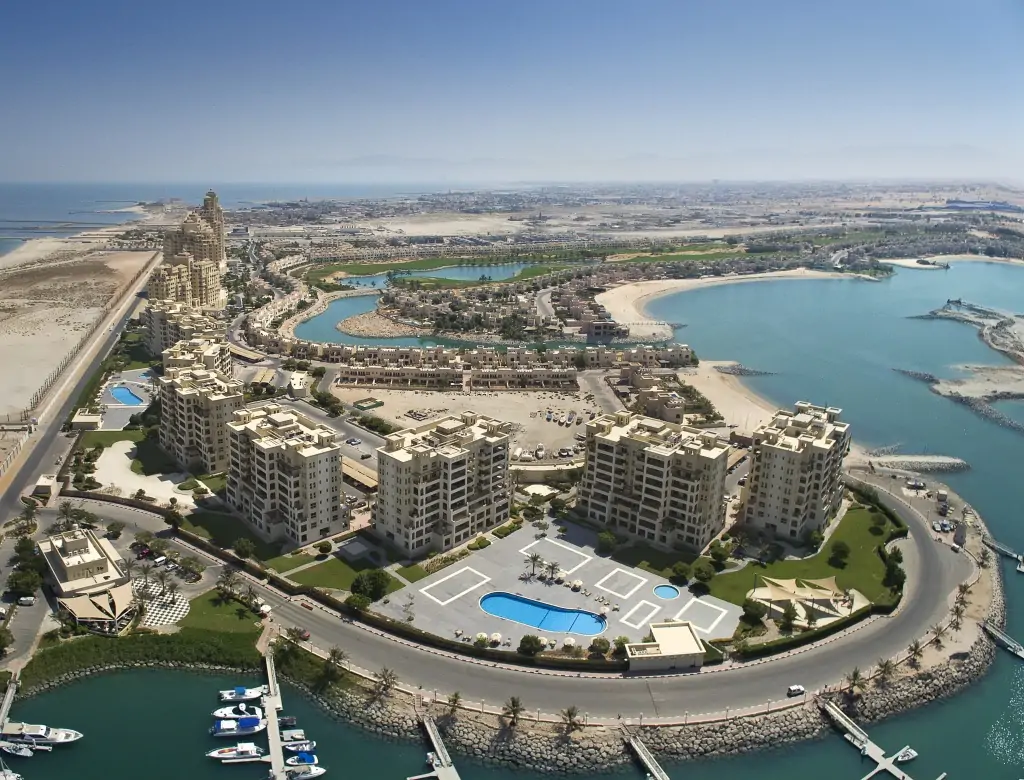
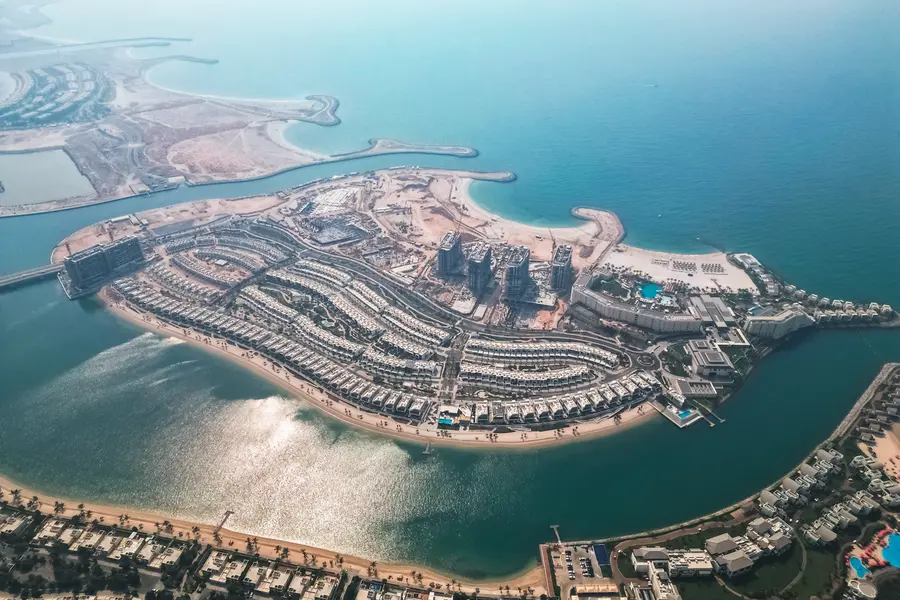
Al Hamra — Stability & High Yields
Established community with exceptional net yields and low volatility.
- 1-BR: Avg price ~AED 1.3m, net yield ~9.5%
- 2-BR: Avg price ~AED 1.8m, net yield ~9.7%
- 3-BR: Avg price ~AED 3.1m, net yield ~9.8%
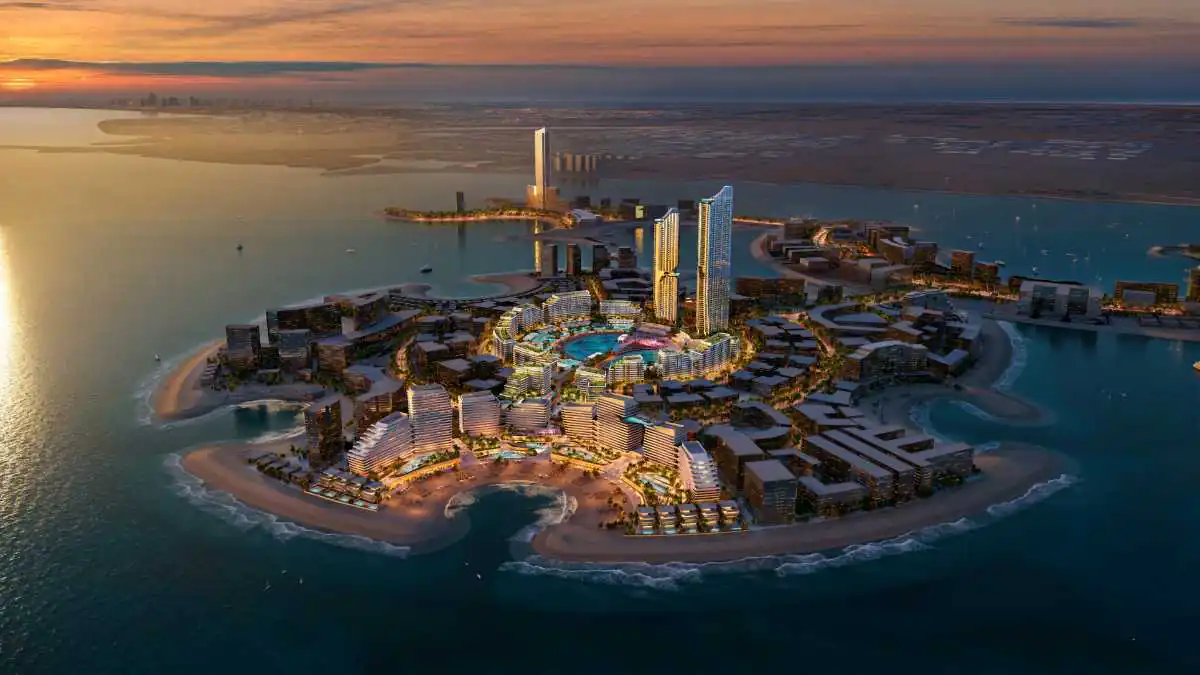
Al Marjan concentrates upside from resort-adjacent launches as hospitality keys come online through 2027.
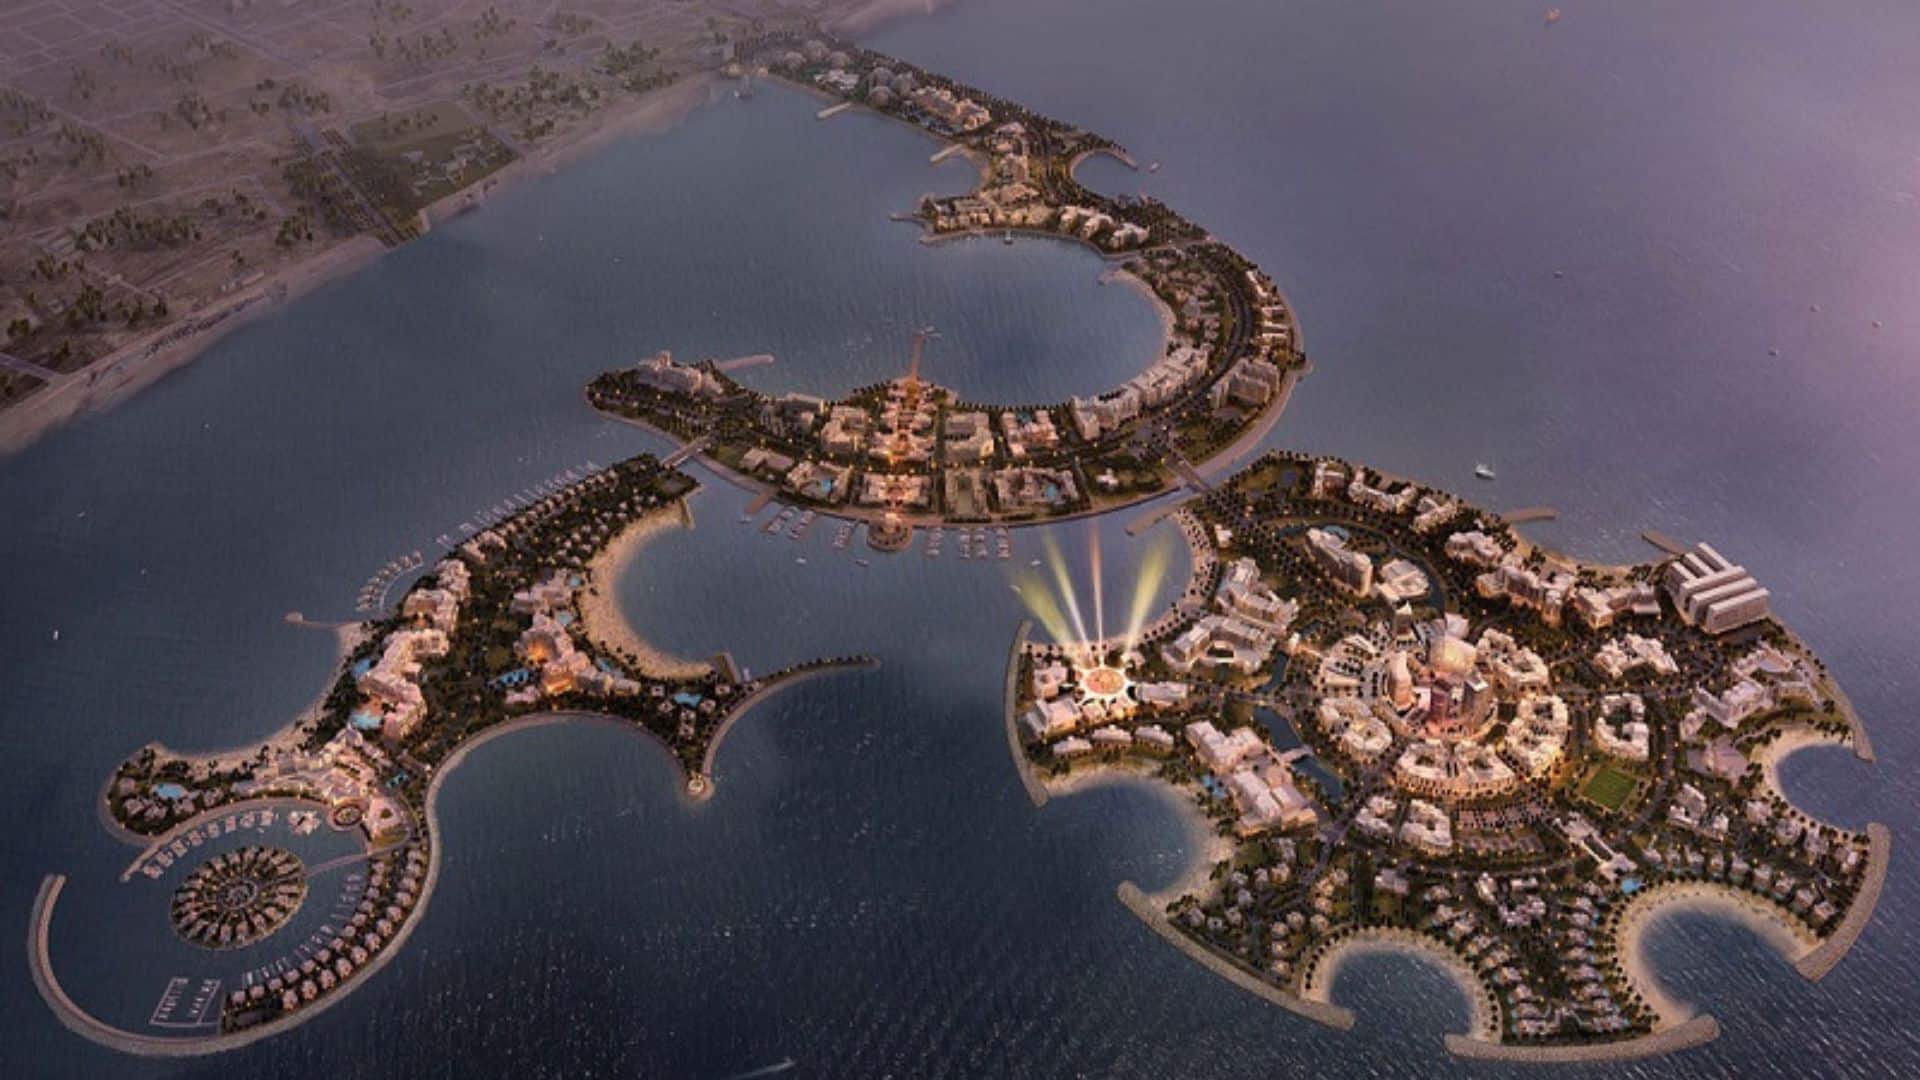
Al Marjan — Growth & Appreciation
The epicenter of new development with exceptional capital growth potential.
- Price per sq.ft (2024): AED 1,067 — +33.3% y/y
- Average ROI (apartments): ~5.75%
- Resort adjacency enhances long-term value proposition
Strategic Advantages
Policy clarity, diversified economy, and targeted infrastructure anchor the cycle.
- Favorable regulations: 100% foreign ownership, zero income/corporate tax
- Diversification: Tourism, manufacturing & trade underpin resilience
- Competitive pricing: Lower entry vs. Dubai with stronger upside
- Government support: Infrastructure & destination marketing
Pricing Benchmarks & Pipeline 2024–2026
Reference ranges for entry points and delivery timelines.
Sea-facing and branded residences command widening premiums into handover.
Pricing Ranges (Indicative)
- Al Hamra Apartments: AED 1,050–1,450 / sq.ft (prime, renovated)
- Al Marjan New Launch: AED 1,250–1,850 / sq.ft (sea-facing premium)
- Townhouses / Villas: AED 900–1,250 / sq.ft (select enclaves)
Phasing matters: early handovers are scarce; the main demand inflection clusters around late ’26–’27.
Delivery Pipeline
- 2025–H1 2026: Early-phase handovers; limited waterfront inventory
- H2 2026–2027: Major resort-adjacent completions (rents inflection)
- 2028+: Stabilization; secondary trading depth expands
Key Data Points 2024–2027
Snapshot of indicators underpinning the outlook.
Tourism Momentum
- 654k visitors in H1 2025 — +6% y/y; revenues +9%.
- On track for 3.5M+ annual visitors by 2030.
Source: RAKTDA updates & major media coverage.
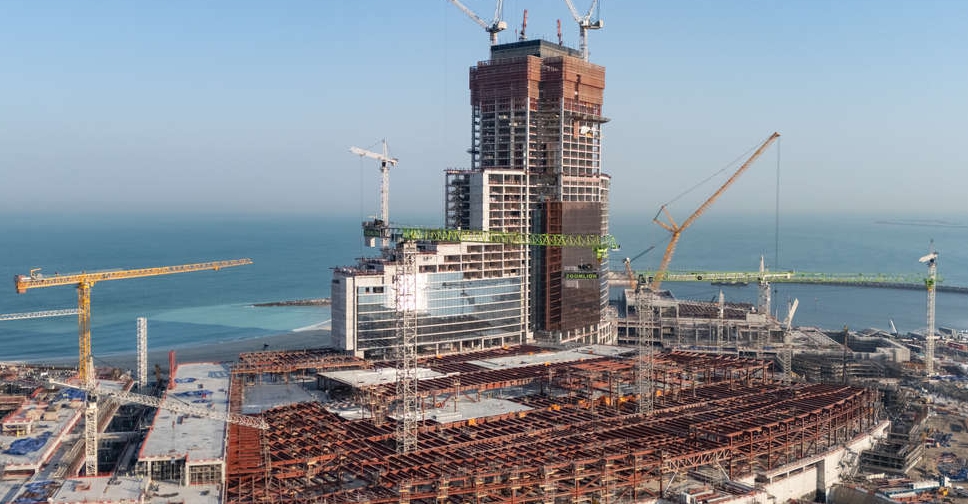
Wynn Resort Timeline
- Opening: early 2027 (Al Marjan)
- Scale: ~1,530 keys; first-look released Apr 2025
- License: Commercial Gaming Facility Operator (2024)
Source: Wynn pressroom; GCGRA; media.
Investor Personas & Scenarios
Align allocation with yield needs, risk, and exit horizon.
For investors prioritizing durable income with lower volatility.
Income-Focused
- Prioritize Al Hamra 1–2BR with proven 7–10% net yields
- Post-handover plans to accelerate cash yield
- Furnishing & operator tie-ups to lift ADR/occupancy
For investors targeting appreciation around destination build-out milestones.
Growth-Focused
- Early-entry waterfront in Al Marjan near the resort axis
- Target 2026–2028 handovers (demand inflection)
- Exit via secondary upon rent stabilization
Blend resilient income with upside capture via staggered commitments.
Balanced (Barbell)
- 50–60% Al Hamra (income), 40–50% Al Marjan (alpha)
- Stagger payments to smooth carry
- Reserve for upgrades to capture rental premium
Key watch-outs and proactive mitigations.
Risks & Mitigations
- Supply surges: focus on prime micro-locations & view corridors
- Delays: developer track record & escrow safeguards
- Rate sensitivity: fixed schedules; staggered entries
Final Word: Positioning for 2025–2030
Al Hamra offers durable cash yields; Al Marjan concentrates upside from tourism and landmark catalysts. A barbelled allocation balances income and growth.
Actionable Takeaways
- Blend high-yield Al Hamra units with select Al Marjan appreciation plays.
- Prioritize inventory aligned to 2027–2030 demand inflection.
- Target post-handover cashflows to smooth carry during construction.
Next Steps
Request tailored shortlists mapped to your budget, desired yield, and exit horizon, with live comps and developer pipeline risk screening.
Access Exclusive RAK Investment Opportunities
Get data-led market analysis, property insights, and personalized investment strategies.
Contact Our Investment Team