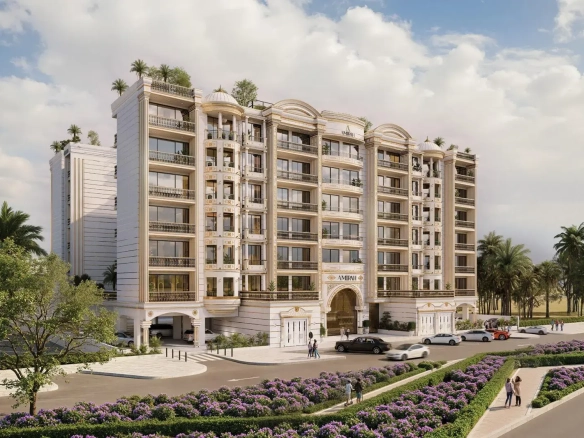
Dubai South is an emerging area in Dubai with growing residential and investment potential. It offers access to main roads and may include nearby malls, schools, or key infrastructure.

Dubai South – Market Analytics
Oct 2025
Rental Yield
6.6%
SOLID
Balanced income profile appealing to end-users and investors.
Liquidity
6.2% • 2.8 MOI
HIGH
Fast-moving market with deep buyer pools.
Off-plan Mix
67.9%
BALANCED
Healthy mix of off-plan and ready demand.
Off-plan Premium
+171.5%
STRETCHED
Elevated premium – focus on unique propositions.
12M Transactions
714
ACTIVE
Consistent 12M volume supports liquidity.
Area Investment Summary
- Rental yield at 6.6% – Balanced income profile appealing to end-users and investors.
- Liquidity shows 6.2% turnover / 2.8 MOI – Fast-moving market with deep buyer pools.
- Off-plan premium at +171.5% – Elevated premium – focus on unique propositions.
- 714 transactions in the last 12M – Consistent 12M volume supports liquidity.
Avg Price (All Types)
AED 1,505
Weighted by off-plan & ready transactions
Total Transactions
714
Off-plan + ready
Turnover Rate
6.2%
Sale MOI
2.8
Months of Inventory
Pipeline Risk
44.6%
Off-Plan Premium
171.5%
Off-Plan / Ready Ratio
67.9%
Rental Yield
6.6%
Turnover Rate (%)
The share of existing housing stock that has been sold over the latest period.
Calculation: 12-month sales ÷ estimated total stock
Higher % = faster-moving market with strong demand. Very low % = slower market with fewer transactions.
Sale MOI (Months of Inventory)
How long the current for-sale supply would last if sales continued at the recent pace.
Calculation: Active listings ÷ average monthly sales
Lower months = tighter supply (seller-friendly). Higher months = more supply, buyers have more options.
Pipeline Risk (%)
Upcoming supply pressure from near-term handovers compared to today's stock and sales.
Calculation: Near-term handover units vs existing stock and recent transaction levels
Higher % = more new stock coming → greater dilution risk for prices/rents. Lower % = limited pipeline → supportive for prices.
Price Volatility Index
How "bumpy" prices have been over recent periods.
Calculation: Variance/dispersion of sale price per sq.ft over time
Higher index = more unstable pricing. Lower index = more stable and predictable market.
Off-Plan Premium (%)
How much more (or less) buyers are paying for off-plan vs ready properties in this area.
Calculation: Difference between average off-plan price per sq.ft and ready price per sq.ft
Positive % = off-plan trades at a premium. Negative % = off-plan trades at a discount vs ready.
Breakdown by Property Type
| Type | Off-Plan Volume | Ready Volume | Avg Off-Plan Price | Avg Ready Price | Yield % |
|---|---|---|---|---|---|
| All Properties | 511 | 203 | AED 1,676 | AED 1,076 | 6.6% |
| Villas / TH / Sky Villa | 121 | 63 | AED 1,415 | AED 1,269 | 9.6% |
| Apartments | 389 | 140 | AED 1,746 | AED 1,006 | 7.6% |
Market Trends - Last 12 Months
12 Properties
Sort by:
3 months ago
3 months ago
5 months ago
6 months ago
7 months ago
8 months ago
8 months ago
8 months ago
9 months ago

1 year ago